

by Steven Saffell
The sounds of transportation, construction, and industry—of civilization itself—are stimulating to some as part of the vitality of the urban environment. Yet, over the long haul, these sounds become intrusive when they filter into indoor environments. Numerous studies document there is much more at stake than mere annoyance, as the effects of background noise suppress productivity, learning, and healing within offices, schools, and hospitals, respectively. Additional facilities commonly affected by noise problems can include places of worship, hotels, multi-family dwellings, libraries, and courthouses.
Generally, sound transmission increases as the glass temperature decreases, indicating sound intrusion may be perceived as worse during the winter, precisely when people are spending more time indoors (possibly exacerbated by COVID-19 shutdowns).
Efforts to decrease the amount of noise reaching occupied spaces commonly focuses on fenestration—at times an entry point if not properly designed for the noise control mission. This is especially true of relatively lightweight construction such as metal curtain wall since sound transmission through any barrier is inversely proportional to the mass of the barrier. However, with careful detailing, based on an understanding of the mechanism of sound transmission, metal curtain walls can reduce intrusive noise.
Measuring sound
Sound is characterized by its frequency (“pitch”) and amplitude (loudness). The amplitude of a sound pulse is the difference between the maximum and minimum sonic pressure that is developed between the crest and trough of the sinusoidal sound wave. This difference is represented as the sound pressure level (SPL) and is perceived as the “loudness” of the sound. The greater the amplitude of a sound wave, the higher the SPL and the louder the sound.
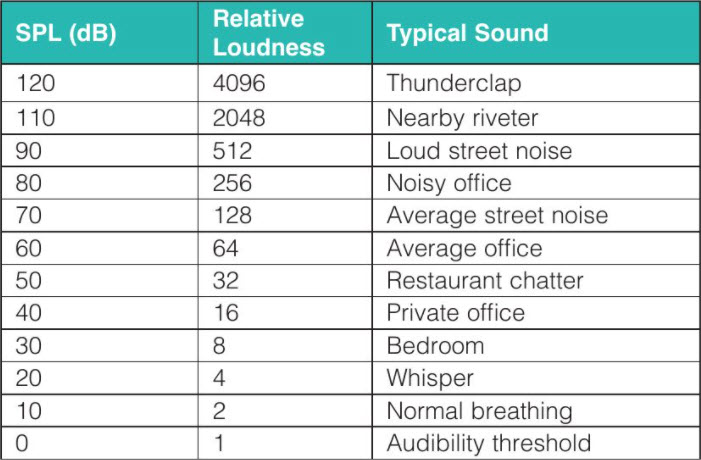
Images courtesy FGIA
SPL of a sound is measured in decibels (dB). A comparison between SPL and relative loudness is shown in Figure 1.
It is important to note the relationship between SPL and perceived loudness is a logarithmic scale; thus the difference between the loudness of a private office is twice that of a bedroom (16 vs. 8 relative loudness), not 1/3 greater (40 vs. 30 SPL). Similarly, the challenge in reducing loud street noise to that of a bedroom translates to reducing the noise level by a factor of 64 (512 vs. 8 relative loudness), not just 2.33 (70 vs. 30 SPL).
When it comes to designing walls to dampen the transmission of unwanted sound, a variety of performance indices are available.
Sound transmission loss (STL), for example, measures the ability of a particular material or wall configuration to reduce impinging sound by indicating the amount in dB by which sound of a particular frequency band is reduced (attenuated) when passing through the material or wall. For example: 12.7 mm (1/2-in.) drywall has an STL of 15 dB for an impinging low-frequency sound at a frequency of 125 hertz. The method for defining STL is given by ASTM E90-09(2016), Standard Test Method for Laboratory Measurement of Airborne Sound Transmission Loss of Building Partitions and Elements.
However, the ability of a material or fenestration product to attenuate sound is better indicated by the two common methods of product classification: Sound transmission class (STC) and outdoor-indoor transmission class (OITC). For both, the higher the number, the more the intruding sound is blocked.
Like decibels, STC scores are on a logarithmic scale so each number is higher than the one before. For example, an increase in STC from 28 to 38 equates to a 90 percent reduction in noise. STC is determined per the methods detailed in ASTM E413, Classification for Rating Sound Insulation. Although STC is generally satisfactory for ranking the ability of building envelope components to reduce higher frequency noise, it does not properly rate insulation against noise sources from the typical outdoor urban environment, which generally has a significant low-frequency component.

