Several U.S. cities have used isochrones—lines that connect geographic points on a map to compare transit travel times—to redesign their transit systems. But the city of Richmond, Va., is using a new interactive tool that takes isochrone-informed transit planning to the next level.
As a design-build team of Lane Construction Corp. and STV Inc. nears completion of Pulse, a $65-million, 7.6-mile bus rapid-transit system, city officials commissioned Michael Baker International and Jarrett Walker & Associates to study how best to improve the existing bus system to maximize efficiency of service in conjunction with the new line.
“The consultants came up with the idea of a mapping exercise [in which] they could show how far people can get within a certain amount of time. We could look at it from the existing system and from the new system,” says Amy Inman, the city’s senior administrator for multimodal transportation and strategic planning. “It is a great communication tool for us. It’s a big deal to overhaul a system like this. Customers are used to small changes.”
Cities such as Houston and Seattle also have employed isochrone maps to overhaul their systems in a big way, but Michael Baker planning experts developed a geographic information system (GIS) tool that allows users to enter a specific address or use the “Click a Place” feature to calculate travel times and see how each concept affects transit access from home, work, the grocery store or any other point within the city.
“We’re working with a subconsultant [Jarrett Walker & Associates] that does this all over the country,” says Scudder Wagg, Michael Baker project manager. “They often use isochrones to help people visualize the freedom transportation can provide when you redesign it. We were working early last summer on initial concepts to show the public three maps of redesigns. I have dabbled in GIS for assessing issues in other transit projects. I felt like it would be powerful to turn this into an interactive tool.”
Scudder asked colleagues in New Jersey to work on converting isochronic data into a GIS format to create a real-time network mapping tool. Overall, the process took about six months, says Mike Mills, Michael Baker software systems developer.
On the Jarrett Walker website, a page dedicated to the project and the tool, called Remix, states: “Because transit plans typically are presented to the public before a schedule exists, comparative isochrone visualizations are rarely used in communicating the benefits of a project in this way. Thanks to Remix, the data needed to generate isochrones for proposed transit plans is easier to develop than ever before. This means that members of the public can now use isochrones to evaluate network proposals, early in a planning process.”
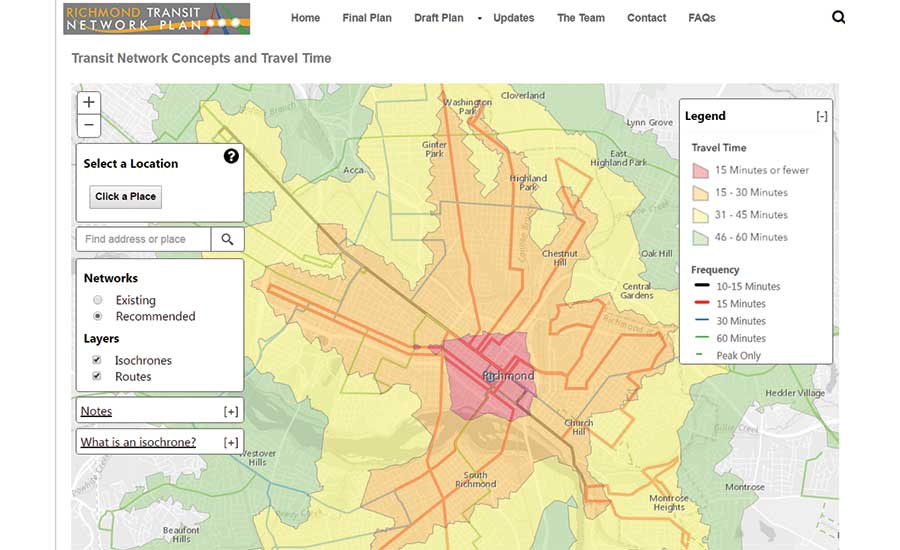
Remix has been deployed this month at scores of public information meetings. “Our web map shows 15-, 30- and 45-minute intervals. Each colored blob shows you have far you can get” within those intervals using each of the three proposed plans. “It’s a … valuable way to help people understand what transit is giving them for their dollar,” says Scudder.
With the public feedback, transit planners will make more informed decisions regarding balancing the frequency and location of stops, depending on specific parts of the city. Moreover, in future transit planning and alternative analysis, “you often sit in a room and come up with alternatives for a bus rapid-transit or light-rail line,” says Scudder. “You can use this tool at the same time, considering other issues like [rights-of-way] constraints.”


Post a comment to this article
Report Abusive Comment