

For many of us ESG and reporting nerds, September and October are a time of great excitement and anticipation as we await the results of our GRESB submissions. Flashbacks from earlier in the summer ensue, and we are transported to July 1, exhausted and obsessively reviewing GRESB submissions one last time. Finally, the courage builds, and we hit submit! What’s done is done, and now it’s time to relax. Summer turns to Fall and finally the day is here. Results are released! From first timers to seasoned veterans, we all anxiously wait for the results page to load and show us our fate.
After the initial excitement of improved performance or disappointment in a lower score or ranking, all GRESB participants face the question of “now what?” “How do I translate these results into something meaningful for clients, investors, and my team?” “How do I improve my score next year?”
This quick guide provides simple tips to interpret and improve your GRESB score, and thus your environmental, social, and governance (ESG) performance and impact. Let’s get to it!
UNDERSTANDING YOUR SCORE AND THE BENCHMARK REPORT
The GRESB Benchmark Report provides great insight into your performance as well as peer performance. The information included can help in discussing results internally and with investors and clients. Peer comparisons also give context to what is happening in the industry overall and can help you understand if a low score means you are behind or your peers as a whole are struggling in one area.
Here, we’ll use a Sample Benchmark Report provided by GRESB to walk through key components of your score and benchmark report.
#1: Overall Score and Ranking
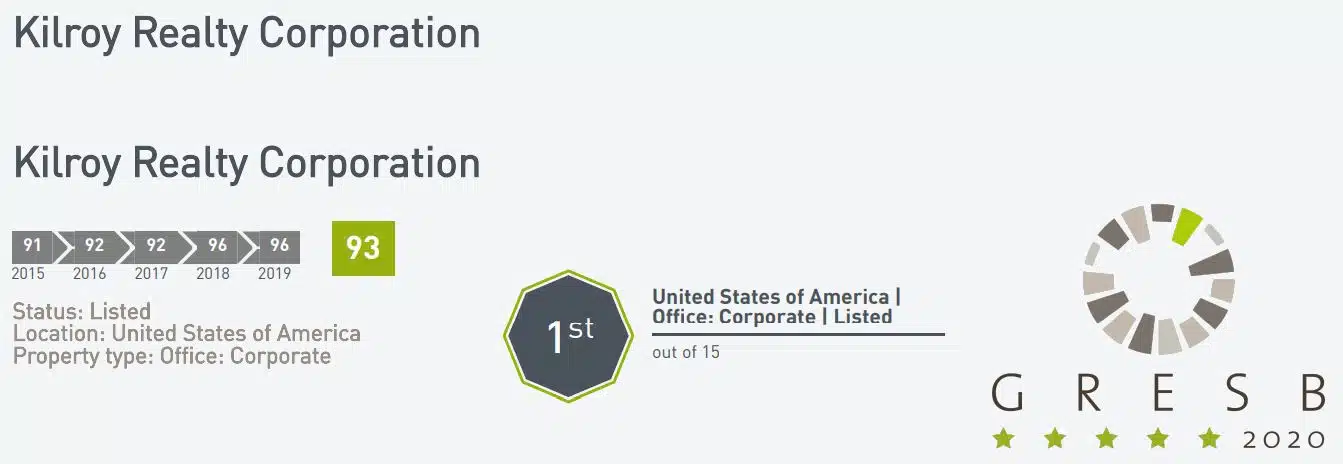
• Overall Score: The first page shows the overall score year-over-year. It is a combination of the Management and Performance scores and measures overall ESG Performance represented as a percentage (100% max).
• Rank: Based on legal structure (public/private), property type, and geographical location, each entity is placed in a peer group with similar portfolio characteristics and benchmarked against the performance of those peers. GRESB provides an entity’s ranking in a number of different groups (i.e. Office Americas or Office Overall, which includes international); however, the peer group ranking is the most commonly utilized and reported.
• Green Stars: Green Star Designation is awarded to Real Estate entities with a score higher than 50% of the points allocated to each relevant component. The higher the number of stars, the better.
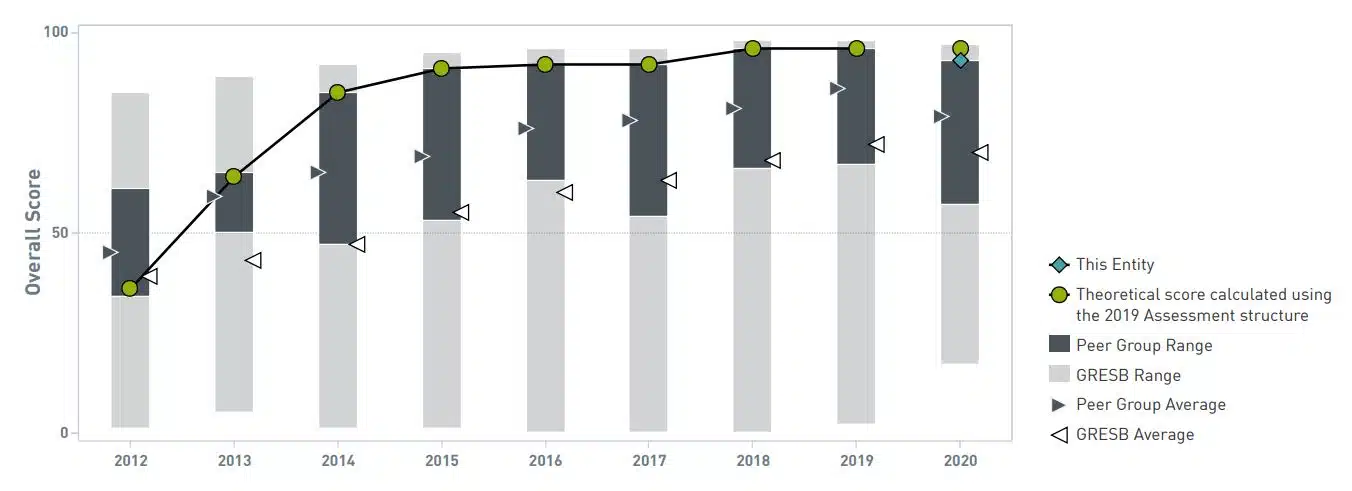
• Trend: This graph shows the trend in performance over time compared to peer group and GRESB average. This is a great chart to illustrate how the industry is maturing and evolving over time. As the industry advances, it becomes more challenging to stay ahead of or in line with peers. In competitive peer groups, every point counts.
#2: GRESB Model and ESG Breakdown
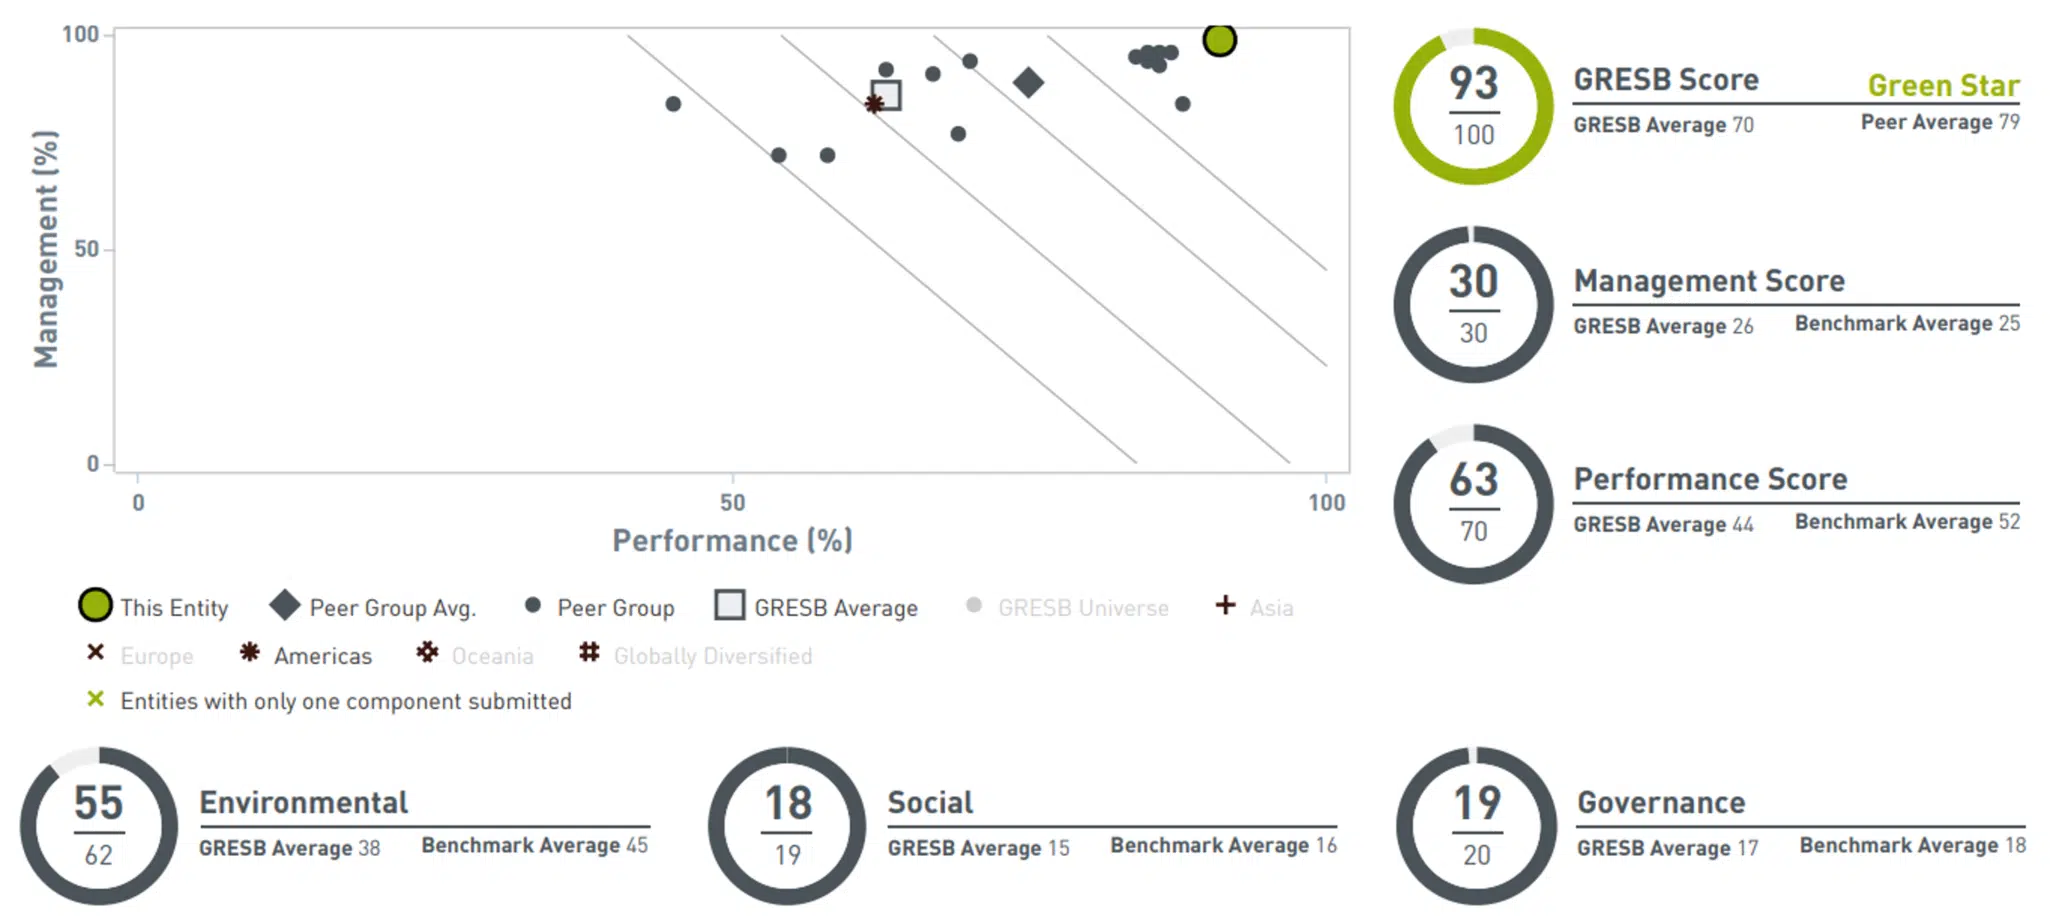
• Management Score: The Management Score is the total number of points earned on the Management Component (Leadership, Policies, Reporting, Risk Management, and Stakeholder Engagement). A breakdown of the points per category can be found in a summary table in the Benchmark Report and points earned per question are listed further down the report.
• Performance Score: The Performance Score is the total number of points earned on the Performance Component (Risk Assessment, Targets, Tenants & Community, Energy, GHG, Water, Waste, Data Monitoring & Review, and Building Certifications). A breakdown of the points per category can be found in a summary table in the Benchmark Report and points earned per question are listed further down the report.
• Performance Scatterplot: This graph shows where an entity sits amongst peers. The bands show the delineation of Green Stars, with the top right representing 5 Stars. Note: if you selected disclose score to peers, you will be able to hover over the dots and see the score of the others that selected this option.
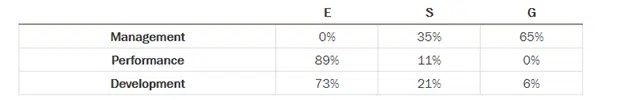
• ESG Breakdown: Each question has been assigned an E, S, or G (see Scoring Document). The score is the sum of points earned for the questions in each group.
o E – Indicators related to actions and efficiency measures undertaken to monitor and decrease the environmental footprint of the portfolio.
o S – Indicators related to the entity’s relationship with and impact on its stakeholders and direct social impact of its activities.
o G – Indicators related to the governance of ESG, policies and procedures, and approach to ESG at the entity level.
o The majority of S and G related questions are in the Management Component while Performance is largely E focused questions.
#3: Strengths and Opportunities Per Aspect

• Strengths and Opportunities: This is a great visual to show the areas in which an entity is excelling and areas where improvements need to be made. This can also be a valuable tool in prioritizing improvements and giving context to the peer group. An entity may have a lower score but still score higher than peers (the gray shading) indicating that this category is challenging across the peer group. Challenges vary by asset type. For example, data for industrial with NNN leases can be hard to attain so Energy, GHG, Water, and Waste are generally lower for industrial than office.
WHAT’S NEXT: IMPROVING YOUR SCORE
Each of the graphics provided by GRESB gives a great overview, but to truly understand what improvements need to be made, you need to drill into the score per question.
#1: Analysis
Analyze the performance per question utilizing the Benchmark Report and this handy scoring document provided by GRESB which details how each question is scored. For all questions that did not earn full credit, compare the responses to the scoring document. Common issues that affect score include not enough options selected, percentage of portfolio coverage is too low for items selected, and/or evidence was not accepted as it does not fully support responses selected.
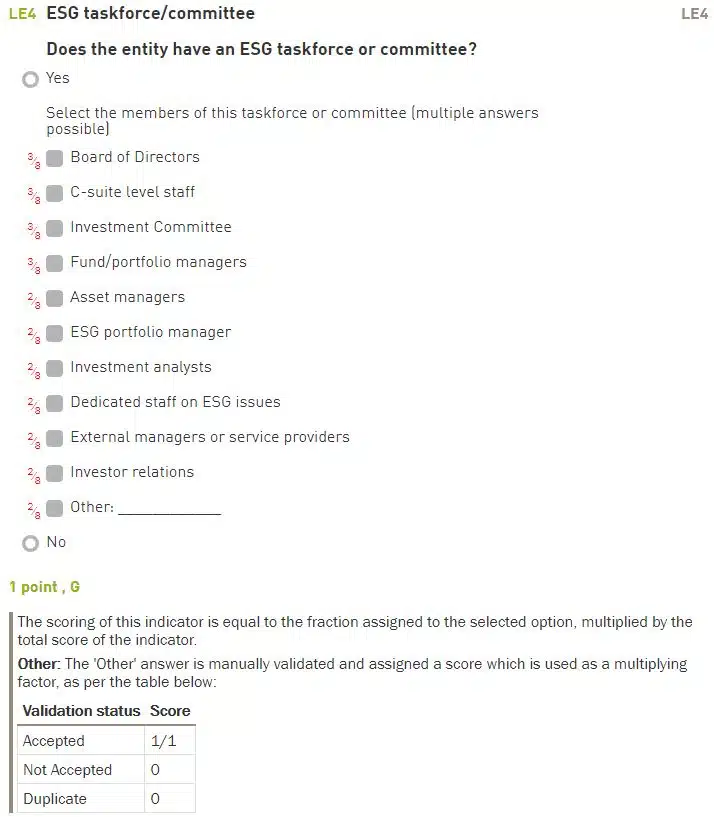
The sample below shows that each option has a different weight. Selected options must add up to 8/8 to earn the full point. If Board of Directors and Investment Analysts was selected, only 5/8, or 0.625 out of 1 point, would be earned for this question.
#2: Make a List
The scoring document provides a roadmap for exactly how to earn full credit. Once you know why your response is lacking, it’s time to develop a list of all the additional programs and procedures that need to be implemented to enhance your ESG program.
#3: Prioritize
It can be overwhelming, expensive, and taxing on resources to implement all improvements at once. There are a few ways to help prioritize what to tackle first:
• Timing: When reporting to GRESB, you are looking back at the previous year. This means for anything to be included in the 2023 submission, it must be implemented by the end of 2022. Prioritize items that can be accomplished from October (when the final results are out) to December. Longer term items can be started in the following year.
• Cost: Is the cost worth the effort and potential points to be earned? If an initiative would be expensive to implement and only earn less than 1 point, it may be worth focusing efforts elsewhere at this time.
• Weight: Each category has a different weight. Prioritizing higher weighted questions will provide greater return.
#4: Implement
Once your priorities are set, it’s time to start tackling your list of improvements!
GRESB scoring, analysis, and strategy can be complicated. If the ESG reporting landscape makes your head spin, Stok is here to help. We have expertise in conducting GRESB Gap Assessments and love helping our clients come up with a solid strategy that provides the most bang for their buck while making substantial ESG improvements. Get in touch to chat GRESB with us and bring your ESG dreams to life!