

The use of low-emittance materials to reduce heat flow across air spaces has been discussed in the technical literature for about 120 years. Reflective insulation assemblies (enclosed air spaces with at least one low-emittance surface in the heat-flow path) have been on the market for at least 75 years. The U.S. National Bureau of Standards (NBS) significantly advanced the use of reflective insulation materials after it published an extensive evaluation in 1954. These data have been represented in the American Society of Heating, Refrigerating and Air Conditioning Engineers (ASHRAE) Handbook of Fundamentals in every edition since 1972.
Like many other thermal insulation materials, reflective insulations depend on the low thermal conductivity of air to provide thermal resistance or R-value. Reflective insulations are unique in that radiative transport across the enclosed air spaces can be reduced to near zero. The reduction in heat flow and resulting R-value is the outcome of reduced radiative heat transfer. The determination of a reflective insulation assembly R-value is done using a hot box facility. The hot box provides one-dimensional steady-state R-values. The large number of possible reflective insulation assembles is a motivation for computational techniques for the evaluation of their thermal resistances. The consideration of factors and conditions that have had limited evaluation in the past is the subject of this article. The thermal data for enclosed reflective air spaces has been limited to large parallel planes and test data from hot box testing of specific configurations. Actual applications that differ from parallel planes and new applications are frequently proposed. The determination of the thermal performance of new reflective insulation applications or performance under conditions other than test conditions or handbook entries can now be obtained using finite element simulations.
Traditional determination of reflective insulation R-value
In many cases, heat transfer takes place by free convection in reflective insulation assemblies. As a result, reflective insulation R-values depend on orientation and heat-flow direction. R-values for reflective insulation assemblies frequently present at least three heat-flow directions: up, horizontal, and down, and many case assemblies include a 45-degree slope from the horizontal to push the total directions to five. In the past, thermal results were provided, for example in the ASHRAE Handbook-Fundamentals, for large parallel surfaces while actual installations were bounded on all sides and exhibited three-dimensional radiative transport. The use of computer simulations provides a way to include realistic assembly features in R-value evaluations. The resulting simulations include the Handbook values that have been used for many years and significantly extends the applications that can be evaluated.
A summary of advanced capability
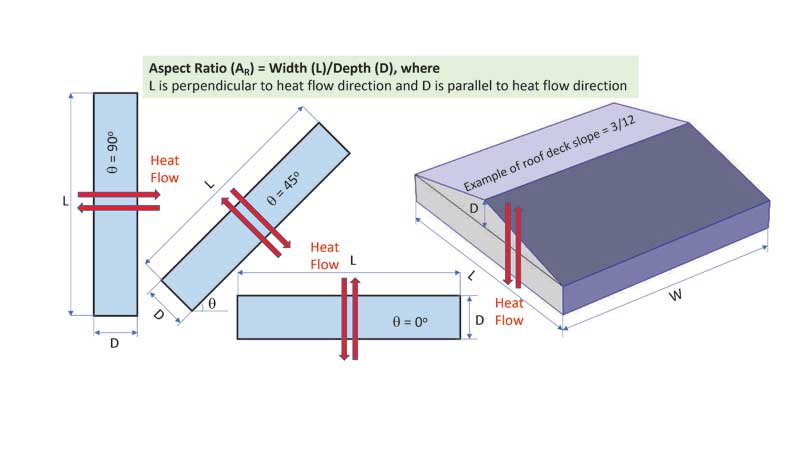
Modern air-space simulations economically relax the one-dimensional constraint and include radiative transport taking place between all sides of the enclosure. The air-gap or distance from the warm surface to the cool surface used to characterize a reflective air space in past evaluations is now supplemented by the aspect ratio (width/depth, W/D) as shown in Figure 1. Assemblies with non-parallel surfaces are readily accommodated in a simulation program. Simulations can readily change emittance values to demonstrate the use of various types of surfaces. Users can evaluate imperfect barriers between enclosures in multilayer assemblies and air infiltration/exfiltration or wind washing. Some of these variables are only observable using a hot box facility at considerable expense while some are beyond the current scope of the test method. Simulations can also evaluate non-rectangular enclosures (triangular, for example).
Examples of simulation results
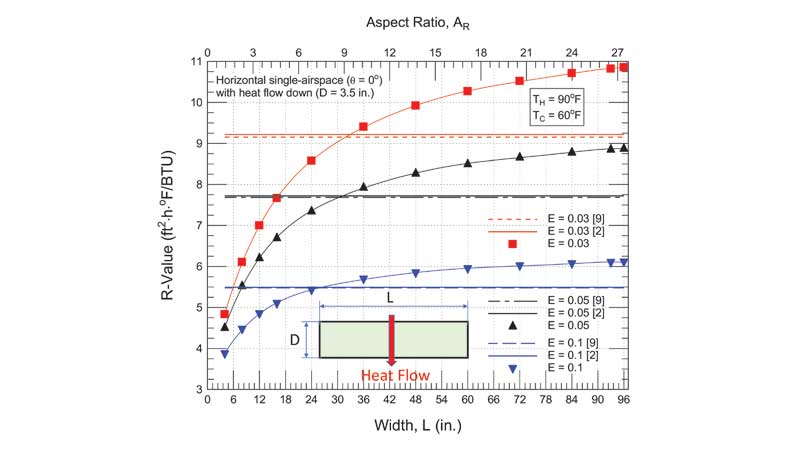
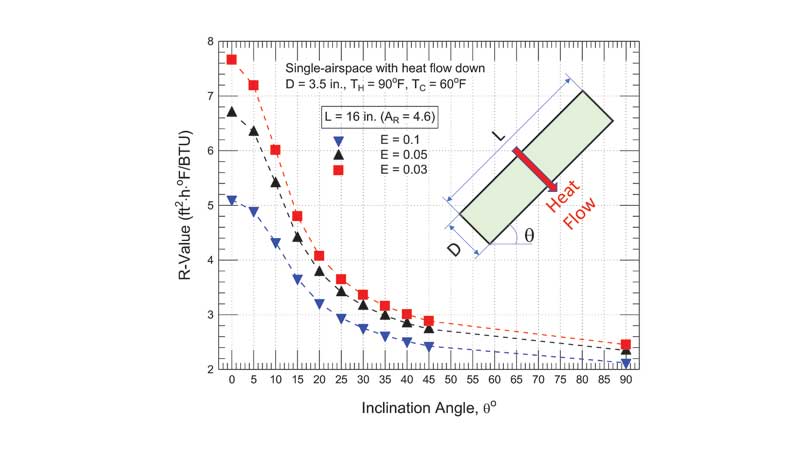
Figures 2 and 3 show the impact of aspect ratio (AR) on the R-value of enclosed reflective air spaces with heat-flow down. The simulations were performed for isothermal surfaces at 32.22 C (90 F) and 15.56 C (60 F) and low-emittance surfaces that are perpendicular to the direction of heat flow. The curves in these figures show R-values for effective emittances of 0.03, 0.05, and 0.10.
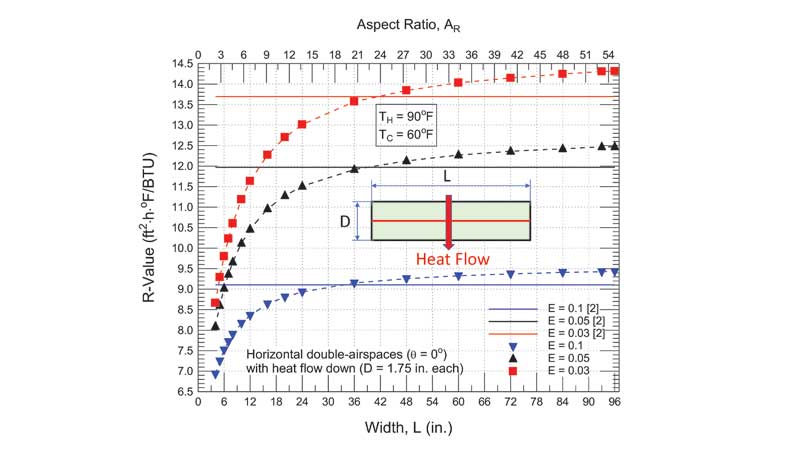
Effective emittances consider the individual surface emittances involved in the radiative heat-transfer process. The surface emittance 0.03 is characteristic of aluminum foil, 0.05 is characteristic of metallized aluminum film, and 0.10 is the limiting value for a reflective insulation in the ASTM International standard specification for reflective insulation. R-values for each of the effective emittances are shown as horizontal lines representing calculations using ISO 69469 or correlations based on the previously mentioned NBS data. In this case, the two traditional techniques agree. When additional dimensional data inputs via the aspect ratio, then there will be significant variation in the R-values by simulation. The results in Figure 2 for effective emittance 0.03 vary from 4.8 to 10.9 sf∙h∙F/BTU while the earlier techniques give a constant value of 9.2. These results tend to favor reflectives in that L is usually greater than 914.4 mm (36 in.) for building envelope applications. The results in Figure 3 where the 88.9 mm (3.5-in.) deep enclosure divides equally to provide two enclosed reflective air spaces follow the same pattern observed for single air space, except the simulated R-values for the double-air space assembly are as much as twice the single air-space values. Reflective insulation manufacturers have used product designs that divide air spaces into smaller regions to increase thermal performance with little increase to material cost.
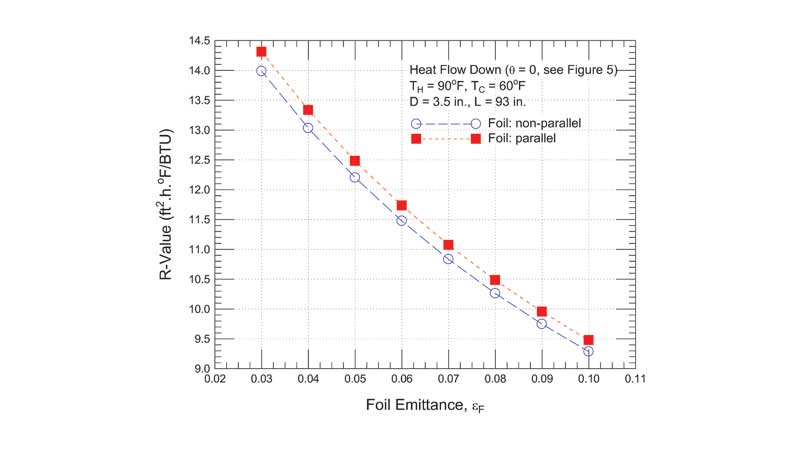
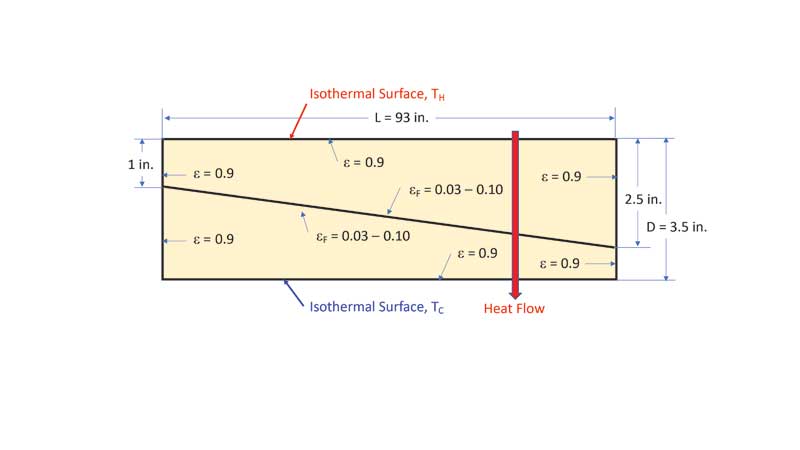
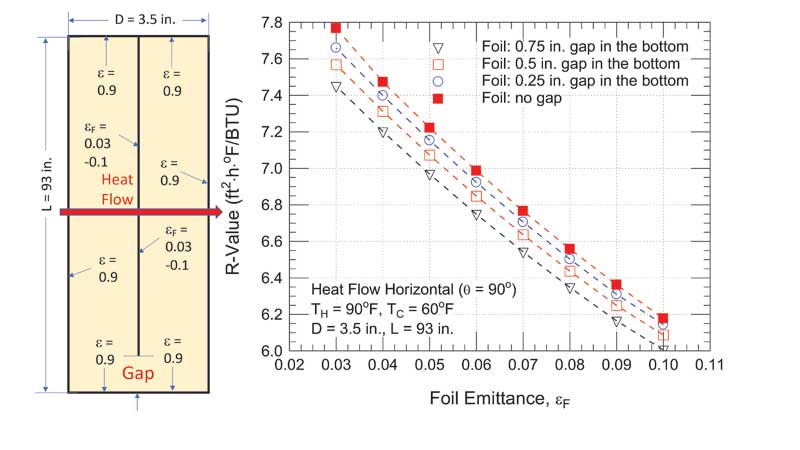
The existing handbook data and correlations for reflective air space R-value calculations generally only consider the five heat flow directions mentioned earlier. Actual construction, however, can involve a variety of heat-flow directions especially in the case of roof assemblies. Figure 4 is an example of the variation of R-value as angle changes for heat flow in a downward direction. The curves in Figure 4 start with heat flow down (θ = zero degrees) from a horizontal surface and end with heat flow horizontal (θ = 90 degrees) from a vertical surface. Installation of reflective insulation products can result in non-parallel surfaces. Simulations can be used to determine the impact of a non-parallel installation on the R-value of the assembly. Figure 5 shows a major deviation from parallel surfaces that form a two-space enclosed region. The simulation results in Figure 6 indicate a reduction of about two percent in the R-value of the assembly due to the surfaces being displaced from parallel. The displacement shown is often viewed as a major installation defect in comparison with perfectly parallel planar surfaces. The impact of incomplete separation of air spaces in a two-space product designed for horizontal heat flow are shown in Figures 7 and 8 (on page 24). Figure 7 shows the impact on the assembly R-value resulting from an open gap at the bottom of the assembly. As expected, the reduction in R-value increase as the size of the gap increases. The simulation results indicate that the reduction in R-value is less than 5 percent until the gap size approaches 19.05 mm (0.75 in.)-a noticeable installation mishap. The situation becomes more serious if gaps occur at the top and bottom, since this provides a path for complete convective loops to form. Loss in R-value is predicted for the smallest gap size considered, 6.35 mm (0.25 in.) at top and bottom. These results emphasize how installation instructions from the manufacturer should address this issue and why installers should pay close attention to instructions.
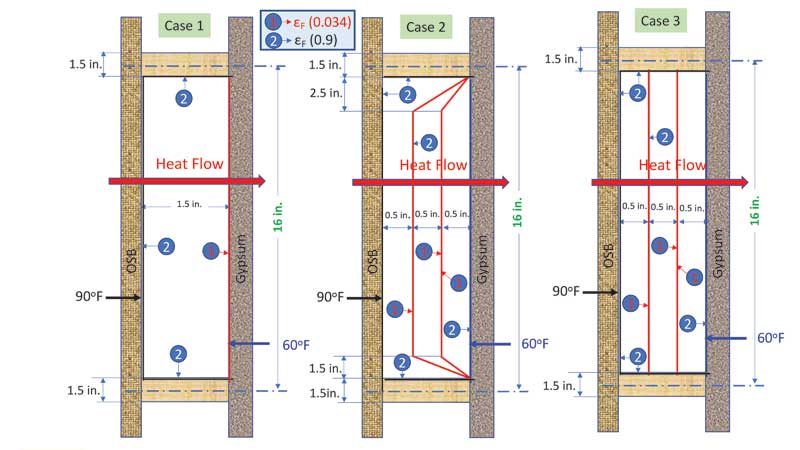
In recent years, the reflective insulation industry has produced assemblies with multiple air spaces. Figure 10 (on page 26) shows simulation results for a basic three region reflective assembly shown in Figure 9 (on page 26). The figure demonstrates a progression from a region with a single reflective air space to a practical assembly followed by an ideal three region assembly. As anticipated, the three-region assembly has simulated R-values about three times higher than the single air space R-value. The non-parallel case of a three-region assembly with non-parallel surfaces falls below the parallel configuration by about 1.5 R-value units.
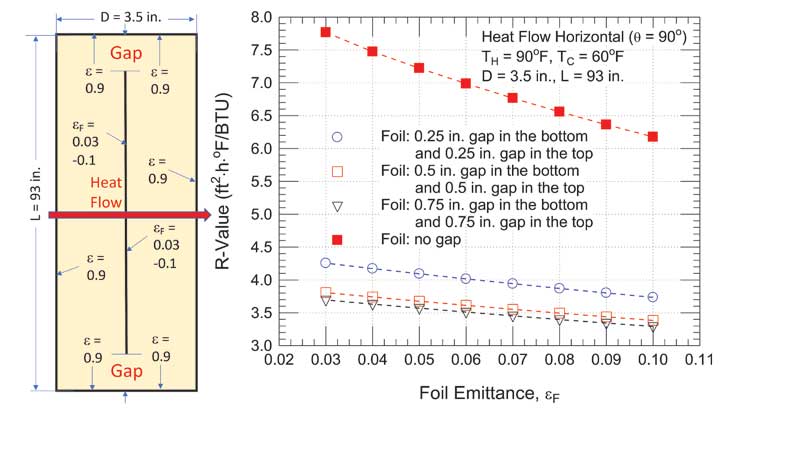
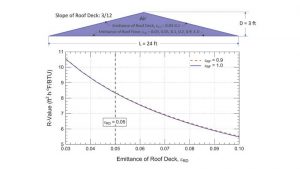
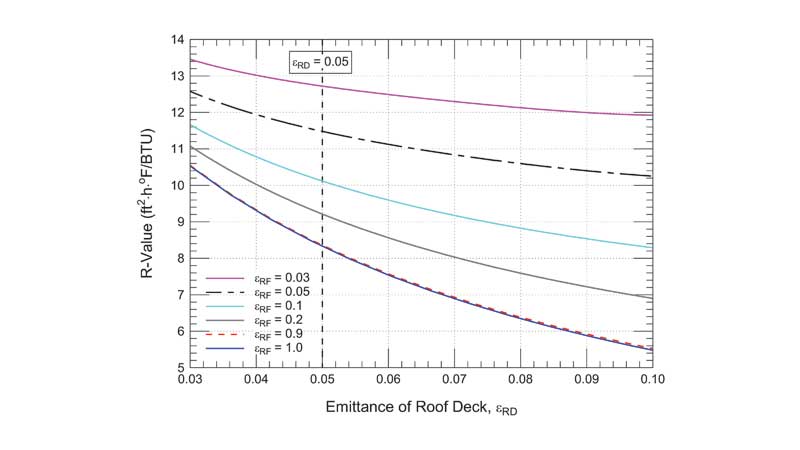
Figure 11 (on page 26) illustrates the unventilated attic space for which the thermal performance of a below roof deck attic radiant barrier was simulated. The attic, in this case, is unventilated. The heat flow direction is downward with the cold side boundary being the top of the attic floor insulation. The overall dimensions of the simulated space were 7.32 m (24 ft) wide and 6.1 m (20 ft) long, with the roof deck slope being a 3/12 pitch. The roof deck simulates a temperature 48.89 C (120 F) while the top of the attic floor insulation was fixed at 32.22 C (90 F). The steady-state thermal resistance for the attic space was calculated from the average heat flux across the top of the attic floor insulation divided by the average temperature difference between the roof deck and the insulation.
The result discussed above is for a steady-state condition with specific thermal boundary conditions (constant roof deck and top of attic insulation temperatures). The actual situation is transient with a roof temperature that likely varies with position especially for steep roofs. In addition, the actual savings due to the presence of a radiant barrier increase when air handing ducts are in the attic. The curve showing R-value as a function of the emittance of the roof deck is also contained in Figure 11 for attic floor insulation surface emittances of 0.9 and 1.0. The difference in R-value between the two values for the attic floor insulation emittance are not significantly different. The attic air space R-value varies from about 10.5 to 5.5 as the emittance of the roof deck radiant barrier varies from 0.03 to 0.10. The vertical line at emittance 0.05 represent an “average” emittance for the radiant barrier assembly with a corresponding attic air space R-value of 8.4 sf∙h∙F/BTU. This R-value is an example rather than a declared value.
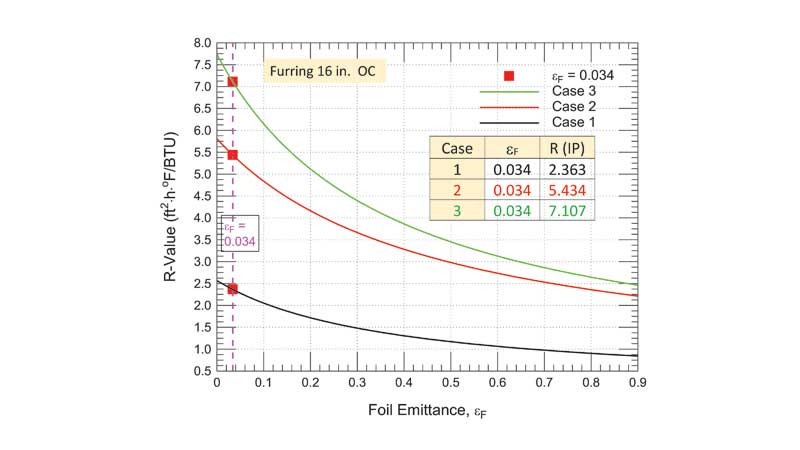
Figure 12 (on page 26) illustrates the significant increase in heat-flow reduction and R-value that could come from adding a radiant barrier material on the top of the attic floor insulation in addition to the roof deck radiant barrier. This application would be useful for situations in which the upward facing radiant barrier is not subject to contamination, for example, by dust, pollen, or fly ash that will increase the emittance of the surface. The results in Figure 12 illustrate the impact of two variables: emittance of the roof deck along the x-axis and several curves for selected emittance values for the attic insulation attic floor surface. As in Figure 11, there is a vertical line in Figure 12 for the case with emittance 0.05 for the roof-mounted radiant barrier showing an increase in the attic space R-value from 8.4 to 12.7 as the emittance of the material above the attic floor insulation decreases from 1.0 to 0.03.
 Conclusion
This article has provided a brief look at the advancing evaluation capabilities being focused on building construction issues. The emphasis in this case has been on reflective airspaces. A significant refinement of the parameters used to describe the air space, the aspect ratio and multi-surface radiative transport, provides an economical way to evaluate potential design and detect areas for installation guidance. The use of the simulation program to model attic radiant barriers is a useful application that provides a snapshot of the thermal performance that can be anticipated. Results that are included in this article shown the impact of aspect ratio, proper installation, and examples of the thermal resistance of unventilated attic spaces.
Authors
 Hamed H. Saber is a deputy of the Prince Saud bin Thuniyan Research Center at the Royal Commission for Jubail and Yanbu, Kingdom of Saudi Arabia. He holds a PhD from University of New Mexico, Albuquerque, New Mexico. His areas of interest include building science, building envelope and structure, Heat, Air and Moisture (HAM) transport, CFD, static energy conversion using thermoelectrics, electronic cooling, sustainable infrastructure and environment, fire modeling, fire safety, heat pipes, thermosyphons, heat exchangers, two-phase flow, waste heat recovery, and numerical modeling. He can be emailed at saberh@ucj.edu.sa
 David W. Yarbrough is vice-president of R&D services, Inc., a testing and consulting firm located in Watertown, Tennessee. He holds a PhD from Georgia Institute of Technology and is an Emeritus Professor of Chemical Engineering at Tennessee Technological University. Dr Yarbrough is a licensed professional engineer in Tennessee and Florida and a Fellow of ASTM International. He can be emailed at dave@rdservices.com


This is very interesting. I’m glad there is finally an automated way to assess the effectiveness, albeit virtual of radiant barriers. Is there a free or open source software that I can download to help me in my energy analysis that includes radiant elements?
I need a reflective foam insulation heat