
The Location-based Management System (LBMS) builds on decades of work on location-based scheduling methods. The first recorded utilization of location-based methods in vertical construction was in the Empire State Building1. More systematic approaches followed. Line-of-Balance was based on optimizing production of identical locations2. Flowline explicitly considered crews3. In many countries these methods were replaced by the Critical Path Method (CPM) because of its analytical power and possibility of showing the impact of changes and delays in a somewhat objective fashion. Location-based methods were significantly developed in Finland, where CPM had not been widely implemented, in 1980s and 1990s. LBMS is the combination of location-based methods and a slightly modified Critical Path Method4. The system includes both detailed calculations for planning and controlling stage and a process for planning and controlling a construction project using LBMS. This process has recently been augmented by incorporating it as part of the Last Planner System process5.
Lowe et al.6 described the key differences between CPM and LBMS. The most important difference on the planning side is a subtle change in the CPM algorithm which forces the tasks to be continuous. This delays the start date of previous locations belonging to the same task so that the work can be performed continuously. LBMS schedule optimization process starts with all tasks flowing continuously (Figure 1) and aims to eliminate the gaps that can be visually seen in the flowline diagram by increasing or decreasing production rates so that all the tasks have the same slope (Figure 2). This optimization is effectively removing float from the schedule. If the production system has variability, LBMS allows for buffers between the tasks. The buffer is different from CPM lags because it can be absorbed without impacting the successor in controlling phase. On the planning side, typical case studies of CPM schedules changed into location-based schedules have saved 10% of project duration without an overall increase in resource use. LBMS does not stop there and includes sophisticated controlling mechanisms that are used to ensure that the duration reductions are achieved in practice.
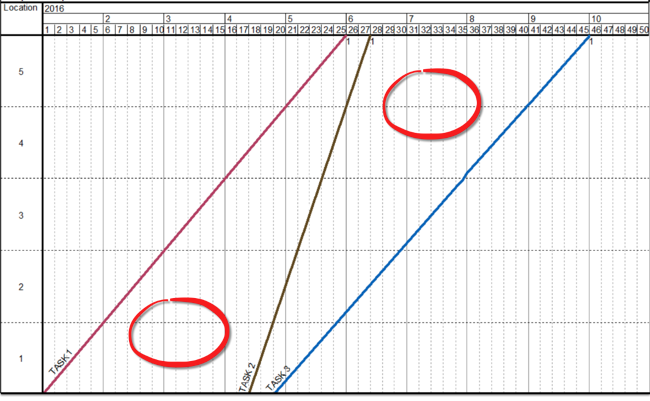
Figure 1: A simple flowline schedule of three tasks. Task 2 is faster than others and its start date has been pulled to start later. Red circles indicate areas of opportunity for optimization. Scheduled total duration is 45 days.
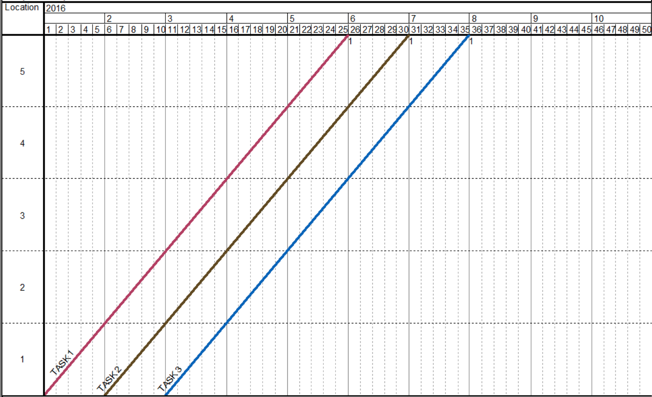
Figure 2: The flowlines of Figure 1 have been aligned by slowing down task 2. The scheduled total duration is 35 days, achieved by decreasing resources.
The original plan stays fixed in the controlling phase of the project unless the team wants to change it. Actual progress is visualized in the same flowline diagram with dotted lines to compare progress to planned. In a flowline diagram, it is easy to see deviations in start dates, production rates or discontinuities of operations. Based on actual progress, LBMS calculates a forecast for each task taking into account the planned dependencies and actual productivity and resources. Forecast will consume buffers first but if all buffers have been consumed and the forecast lines clash, an alarm is generated (Figure 3). The task of production management is to take actions to prevent the alarms from turning into production problems. This is very different from CPM where new planned dates are calculated based on a monthly schedule update and all upcoming locations will have the initial planned duration without taking into account actual production so far. While CPM-based management focuses on hitting dates, LBMS focuses on speed of production and preventing production problems. Production problems cause cascading delays which can impact project durations by 10%7.
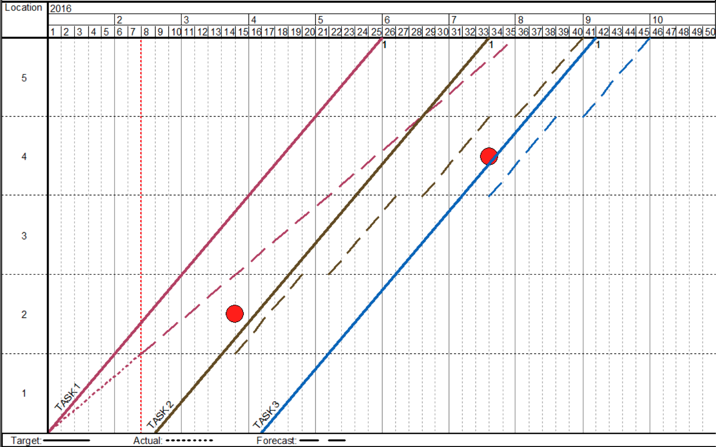
Figure 3: Three day buffers have been added to the plan of Figure 2. Task 1 started on time but is going too slowly (dotted line). Forecast line (dashed line) is based on actual production rate. An alarm dot is shown where task 1 has used all its buffer and will cause a problem for task 2. The alarm is seven days away, giving management time to prevent the problem.
LBMS and Last Planner System (LPS) are complementary processes5. LBMS focuses on preventing interference between trades and LPS focuses on the social processes of planning and commitment. An important part of LPS is look-ahead planning which includes screening for constraints. If constraint screening is not properly done, a task that looks continuous in an LBMS schedule may in fact suffer from delay starts and stops. Screening for constraints and weekly commitment for tasks can highlight production problems which are not apparent from purely technical LBMS alarms. On the other hand, forecasts based on actual production rates can highlight issues that are unknown to Last Planners. The combined process brings more issues to the surface earlier and allows the team to solve problems before they happen!
In conclusion, LBMS is in many ways similar to CPM. In fact, if the tasks were not forced to be continuous and there were no buffers, both LBMS and CPM algorithms would calculate exactly the same dates. LBMS fixes many shortcomings of CPM from a lean perspective by focusing explicitly on the flow of crews and allowing the schedule to be optimized. The biggest differences exist on the controlling side where LBMS focuses on preventing future problems through forecasting and alarms. This makes LBMS more suitable for use as the scheduling system in projects implementing lean construction because the goals align with the Last Planner System and the processes can be combined. Future posts will go into more detail about how the system works, describe the combined process and present practical examples.
References
1. Willis, C. and Friedman, D. (1998). Building the Empire State Building, W.W. Norton and Company, New York.
2. Lumsden, P. (1968). The Line of Balance Method, Pergamon Press, Oxford.
3. Mohr, W. (1979). Project management and control (in the building industry). Department of Architecture and Building, University of Melbourne. 2nd edition.
4. Kenley, R., and Seppänen, O. (2010). Location-based Management System for Construction: Planning, Scheduling and Control. Spon Press, London and New York
5. Seppänen, O., Modrich R-U. & Ballard, G. (2015). Integration of Last Planner System and Location-Based Management System. Proceedings of the 23rd Annual Conference of the International Group for Lean Construciton. Perth, Australia, July 29-31. Available at iglc.net
6. Lowe, R., D’Onofrio, M., Fisk, D. & Seppänen, O. (2012). A comparison of location-based scheduling with the traditional critical path method. Paper prepared for the American College of Construction Lawyers 2012 Annual Meeting, San Francisco, CA, available at http://goo.gl/5aFLT (accessed 24 February 2016).
7. Seppänen, O. (2009). Empirical research on the success of production control in building construction projects. Ph.D. Dissertation, Helsinki University of Technology.

